The Budget Trap That Hits Every Public Institution
King County faces a familiar cycle: deficits, targeted cuts, new taxes, repeat. A Theory of Constraints lens on their own public data suggests the measuring stick itself may be the problem.
TL;DR
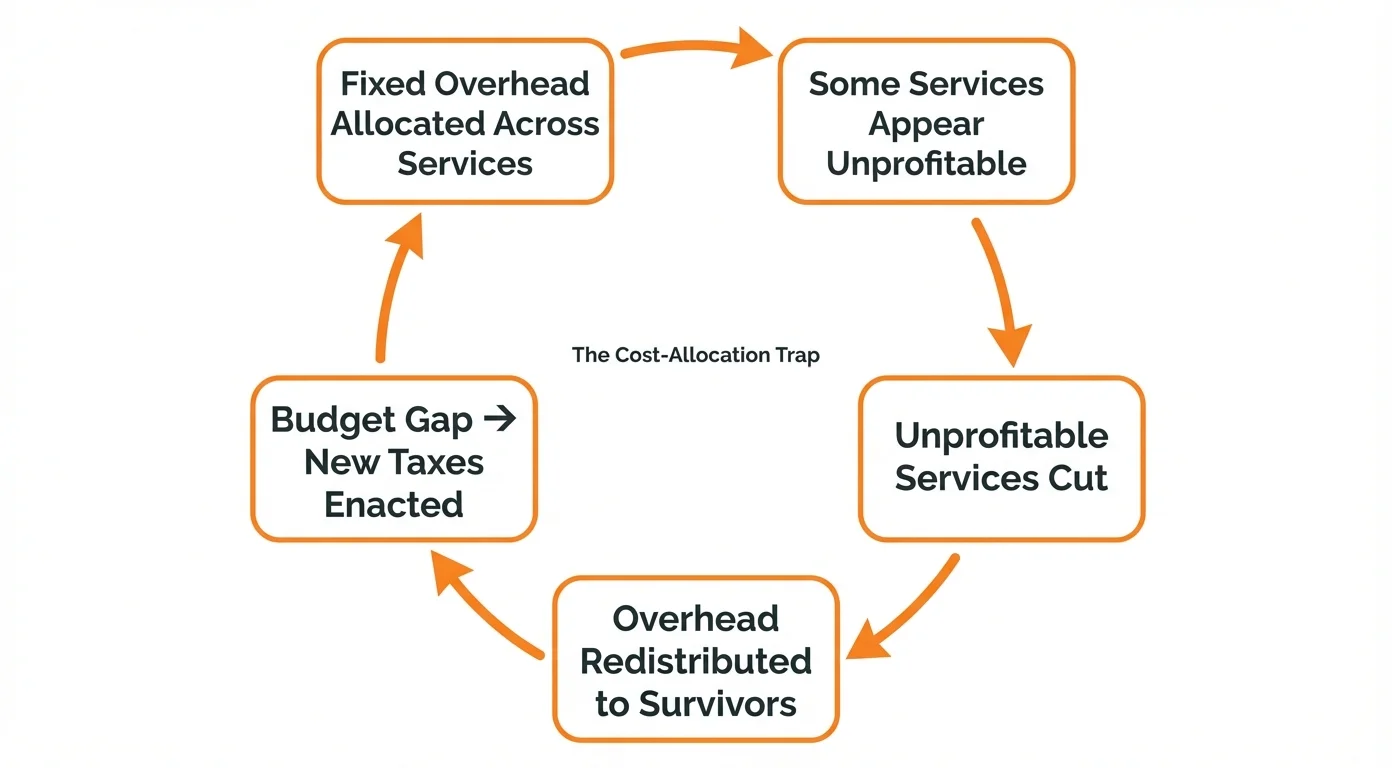
King County’s own budget documents reveal a textbook cost-allocation trap: massive fixed overhead gets spread across service lines, making some look like losers. Cutting the “losers” does not remove the overhead. New taxes close the gap. The cycle repeats. Nobody is doing this wrong. The accounting methodology itself produces this outcome.
I have been writing about how standard cost accounting distorts service line decisions in healthcare. The response surprised me. Several people asked: does this same dynamic show up in local government?
I thought it might. So I spent an afternoon with King County’s publicly posted budget documents, financial reports, and council proceedings. What I found is the same pattern, running at a much larger scale, with the same structural cause.
This is not a critique of King County’s leadership. The people making these decisions are working hard with the tools they have. The problem is that the tools themselves produce a specific kind of blindness.
What the public data shows
King County is Washington State’s largest county. About 2.4 million residents, 18,000 employees, a biennial budget of roughly $20 billion. Those are big numbers, but the picture gets much smaller once you understand the structure.
About 83 percent of that $20 billion is locked in dedicated funds. Metro Transit fares pay for transit. Sewer fees pay for wastewater. The EMS levy pays for emergency medical services. By law, those dollars cannot cross boundaries. The county’s General Fund, the only truly flexible money, is about 14 percent of the total. Roughly $1.3 billion a year.
And nearly three-quarters of that General Fund is consumed by state-mandated criminal justice and public safety: the Sheriff’s Office, courts, prosecutors, public defense. These are not optional. The actual discretionary budget for Washington’s largest county is remarkably thin.
On top of this, King County runs a formal “central rates” system. Information technology, facilities management, accounting, human resources, and other shared services operate as internal service funds. They charge other county agencies for their services through allocated rates. The county’s own financial policies state that these central rates should be “predictable, replicable, transparent, and relatively stable over time.”
That language describes a well-managed cost allocation system. It also describes, precisely, the mechanism that creates distorted service line decisions.
The cycle
Here is what the budget record shows over the past several years:
A deficit appears. For the 2025 budget, the projected shortfall was about $150 million over the coming biennium. Some services face cuts. The Sheriff’s Office was looking at $30 million in reductions. The Prosecuting Attorney’s Office faced $15.5 million in potential cuts. Behavioral health programs were on the block.
The county lobbies the state legislature for new revenue authority. In 2025, the legislature passed HB 2015, giving qualifying counties permission to impose a new 0.1 percent sales tax for criminal justice purposes. King County enacted it. Projected revenue: about $203 million for 2026-2027. They also expanded a hospital property tax levy.
The deficit is “closed.” The 2026-2027 budget was adopted with no major service cuts. Council members expressed relief. The cycle pauses.
But the structural gap has not changed. The county’s own documents have been saying for years that property tax revenue, capped at 1 percent annual growth by a 2001 voter initiative, cannot keep pace with costs that grow at 3.5 percent in normal times and 5 to 9 percent during inflation. The county executive’s budget summary has explicitly called this unsustainable. And the pattern predates the current administration: similar gaps, similar patches, going back over a decade.
What TOC sees that the budget process does not
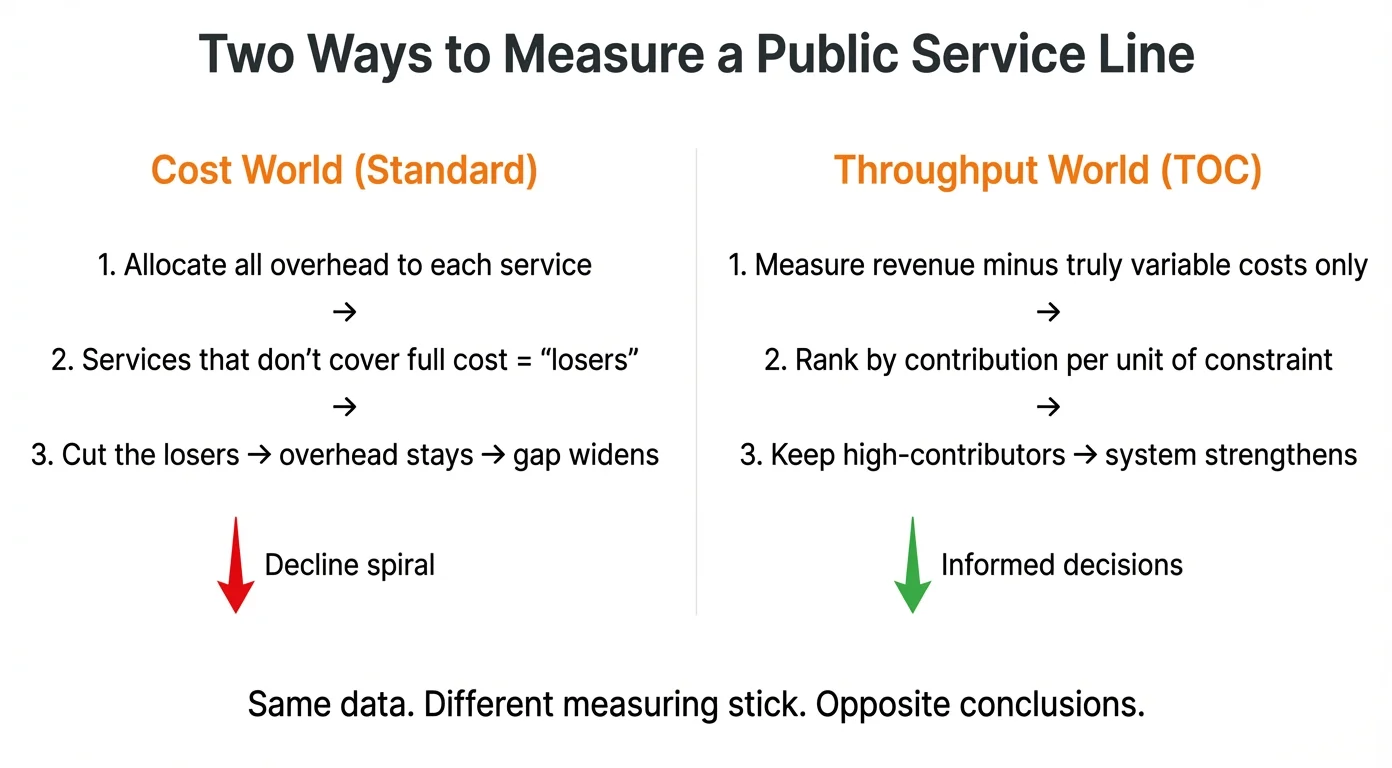
In Theory of Constraints, there is a distinction between the cost world and the throughput world. The cost world asks: “How much does this service line cost after overhead allocation?” The throughput world asks: “How much cash does this service line contribute above its truly variable costs, and how does that contribution relate to the system’s binding constraint?”
King County operates firmly in the cost world. Every service line carries a load of centrally allocated overhead. When a service is cut or reduced, the overhead does not disappear. It gets redistributed to the surviving services, making each of them look a little more expensive. The remaining services now have a harder time justifying their budgets. The system gets smaller and weaker, but the fixed costs remain stubbornly intact.
The throughput question has a different starting point: what is the actual constraint on this system’s ability to generate public value? For King County, the binding constraint is almost certainly not any individual service line. It is the revenue ceiling imposed by the 1 percent property tax cap, combined with the limited sales tax base that shifts most revenue to cities when sales occur within city limits.
Given that constraint, the right question for each service line is not “does it cover its fully allocated cost?” but “how much net cash does it contribute per unit of the scarce resource it consumes?” Some services that look like losers after overhead allocation may actually be strong contributors when measured by what they bring in above their truly variable costs. Others may look profitable only because they have been assigned a smaller share of overhead.
Nobody in the King County budget process appears to be asking this question. I cannot find it in the budget books, the executive summaries, the council proceedings, or the financial policies. That does not mean nobody has thought about it privately. But it is absent from the public decision-making framework.
The hardware store version
I keep coming back to a simple analogy because it grounds the abstraction.
Joe runs a hardware store. He sells shovels, drills, lawn mowers, and plants. His real constraints are staff hours and floor space.
Joe’s accountant allocates rent, utilities, and overhead across all four product lines by sales volume. Lawn mowers come out looking like losers. Joe cuts them and adds more plants.
Sales drop. It turns out mowers were the traffic magnet. Customers came in for mowers and bought everything else. Mowers used almost no staff time once placed on the floor. Plants, by contrast, soaked up staff hours: watering, advising, hauling. By cutting the “loser,” Joe starved his constraint of the product that generated the most cash per hour of staff time and per square foot of floor.
When Joe switched to measuring each product by cash contribution per unit of constraint, he reversed the decision. Profits jumped.
King County is Joe’s hardware store, except the products are public safety, transit, behavioral health, housing, and parks. And the stakes are not quarterly profits. They are whether 2.4 million residents get the services they need.
What a different measuring stick would look like
I am not suggesting King County can adopt throughput accounting overnight. Government accounting standards exist for good reasons, and I respect the constraints that public finance professionals operate within. But I am suggesting that the current framework has a specific, identifiable blind spot, and that blind spot may be contributing to a cycle that the county’s own leaders have called unsustainable.
If county budget analysts were to run a parallel analysis, contribution margin before overhead allocation, for each major service area, the results would almost certainly look different from the fully loaded view. Some services currently flagged for cuts might turn out to be net cash contributors. Others currently protected might turn out to consume more of the scarce constraint than they return.
That parallel analysis does not require new software, new staff, or a consulting engagement. It requires a spreadsheet with two columns: revenue by service line, and truly variable costs by service line. The difference is the contribution margin. Rank the services by contribution margin per unit of the binding constraint (in King County’s case, per dollar of flexible General Fund revenue consumed), and you have a different picture.
A self-assessment for public officials
If you manage a multi-service-line public budget, whether county, city, school district, or hospital district, here is a quick diagnostic you can run against your own public data. Paste the following prompt into any frontier LLM (Claude, ChatGPT, Gemini, Grok, etc.) along with your organization’s name and let it do the research. These systems can pull public budget documents, financial reports, and council proceedings on their own. You do not need to gather the data yourself first:
Given an organization with the following characteristics, assess whether it may be caught in a cost-allocation trap:
- How many distinct service lines or programs does it operate?
- What is the approximate ratio of fixed overhead to total operating costs?
- Does it use a formal cost allocation plan that distributes overhead across service lines?
- Has it cut or reduced any service lines in the past five years based on financial performance?
- Did the fixed overhead decrease proportionally when those services were cut?
- Has the organization raised taxes, fees, or levies to close budget gaps in the past five years?
- Has it ever ranked service lines by cash contribution per unit of its binding operational constraint?
If the answers to questions 1-3 are yes, questions 4-6 are yes, and question 7 is no, the organization is likely experiencing the cost-allocation trap described in Theory of Constraints literature.
For King County, the answers are clear from their own published documents. More than 10 service lines, yes. Heavy fixed overhead distributed through central rates, yes. Service lines targeted for cuts based on financial performance, yes. Fixed overhead did not decrease proportionally, yes. Multiple new tax measures enacted to close resulting gaps, yes. Service lines ranked by throughput per constraint, no evidence of it.
That does not make King County unusual. It makes them normal. This is how virtually every multi-service public institution in the country manages its budget. The methodology is standard. The distortion it produces is also standard.
What this is and what it is not
This is a TOC practitioner looking at publicly available data through a specific analytical lens. I believe the pattern is real and the implications are significant. I also recognize that public budgeting operates under constraints, legal, political, and institutional, that private-sector operations do not face. The 1 percent property tax cap is not a problem King County can solve on its own. Federal funding uncertainty adds another layer of unpredictability. And elected officials face pressures that no analytical framework fully captures.
I am not arguing that King County should ignore its cost accounting. I am arguing that it should supplement it with a parallel view: contribution margin before allocation, ranked by the system’s actual constraint. The two views together would give decision-makers something neither view provides alone.
If you are a county council member, a budget analyst, or a CFO at a public institution that recognizes this cycle, I would be glad to hear whether this analysis matches what you see from the inside. I could be wrong about important details, and the only way to find out is to ask.
You can reach me at john@common-sense.com. The companion article on cost accounting in healthcare shows how this same dynamic plays out in hospital service line decisions. The pattern is not industry-specific. The measuring stick is.